Brief Analysis of Independent/Unionist Vote in Catalonia
Catalan elections
On a train from Barcelona-Madrid I started working with an R package called ggrides. To my surprise, the package contains one dataset that documents the change in independent/unionist vote for all Catalan municipalities from 1980 to 2015. This is very cool! Needless to say, I left what I was doing and started to dive into the dataset.
The data looks like this:
library(ggridges)
Catalan_elections
## # A tibble: 20,764 x 4
## Municipality Year Option Percent
## <chr> <int> <chr> <dbl>
## 1 Abella de la Conca 1980 Indy 68.4
## 2 Abella de la Conca 1984 Indy 95.7
## 3 Abella de la Conca 1988 Indy 89.4
## 4 Abella de la Conca 1992 Indy 81.7
## 5 Abella de la Conca 1995 Indy 80.0
## 6 Abella de la Conca 1999 Indy 74.7
## 7 Abella de la Conca 2003 Indy 84.4
## 8 Abella de la Conca 2006 Indy 73.2
## 9 Abella de la Conca 2010 Indy 75.9
## 10 Abella de la Conca 2012 Indy 84.0
## # ... with 20,754 more rowsVery straight forward. It’s the ‘Indy’ or Independent vote and the ‘Unionist’ vote from 1980 until 2015. The data is complete for nearly all Municipalities, meaning that the data is available for all years. Only a handful (~ 40) do not have data starting from 1980.
Basically, I wanted to answer one question: has the indepence vote grown over time? This question is of general interest considering that the topic is being hotly debated in the media and next week new Catalan elections will be held in a scenario never seen before; after independent parties proclaimed unilateral independece and the government seized control of Catalunya. The elections are predicted to be very contested with Independent parties losing some votes.
With that said, let’s dive into the data!
Analysis
# Load my libraries
library(scales)
library(tidyverse)

# Change abbreviated Indy and Unionist to long names
Catalan_elections$Option <- with(Catalan_elections, ifelse(Option == "Indy", "Independent", "Unionist"))


# Summarize the median independence/unionist vote for
# all municipalities on the first/last year recorded
avg_pl <-
  Catalan_elections %>%
  group_by(Municipality, Option) %>%
  summarize(first_year = first(Percent, Year),
            last_year = last(Percent, Year)) %>%
  group_by(Option) %>%
  summarize(first_year = median(first_year, na.rm = TRUE),
            last_year = median(last_year, na.rm = TRUE)) %>%
  mutate(id = 1:nrow(.)) %>%
  gather(year, value, -id, -Option)

# Summarize the indy/unionist vote for
# the first/last year for Barcelona
bcn_pl <-
  Catalan_elections %>%
  filter(Municipality == "Barcelona") %>%
  group_by(Municipality, Option) %>%
  summarize(first_year = first(Percent, Year),
            last_year = last(Percent, Year)) %>%
  mutate(id = 1:nrow(.)) %>%
  gather(year, value, ends_with("year"))

# Create a base parallel plot with both
# unionist/independence votes pooled
base_plot <-
  Catalan_elections %>%
  group_by(Municipality, Option) %>%
  summarize(first_year = first(Percent, Year),
            last_year = last(Percent, Year)) %>%
  mutate(id = paste0(Municipality, "_", Option)) %>%
  gather(year, value, ends_with("year")) %>%
  ggplot(aes(year, value)) +
  geom_point(alpha = 0.1, size = 2) +
  geom_line(aes(group = id), alpha = 0.1)

# Add the median summary line for both indy/unionist
median_plot <-
  base_plot +
  geom_point(data = avg_pl, aes(year, value),
            colour = "red", alpha = 0.5, size = 2) +
  geom_line(data = avg_pl, aes(year, value, group = id),
            colour = "red", alpha = 0.5, size = 2)

# Add the change of Barcelona for both indy/unionist vote
bcn_plot <-
  median_plot +
  geom_point(data = bcn_pl, aes(year, value),
             colour = "blue", alpha = 0.5, size = 2) +
  geom_line(data = bcn_pl, aes(year, value, group = id),
            colour = "blue", alpha = 0.5, size = 2)


# Separate the plot for indy/unionist in different
# panels and add pretty options
pretty_plot <-
  bcn_plot +
  scale_x_discrete(name = NULL,
                   labels = c("1980",
                              "2015")) +
  scale_y_continuous(name = "% of votes in favour of:",
                     breaks = seq(0, 100, 20),
                     labels = percent(seq(0, 1, 0.2))) +
  facet_wrap(~ Option, strip.position = "bottom") +
  labs(
    title = "Independence/Unionist vote in Catalonia in three decades",
    subtitle = "Red line is the median change for all municipalities - Blue line is Barcelona",
    caption = "Data collected by @marcbeldata - Plot and analisis by @cimentadaj"
  ) +
  theme_minimal() +
  theme(
    plot.title = element_text(size = 16, family = "Arial-BoldMT"),
    plot.subtitle = element_text(size = 12, color = "#666666"),
    plot.caption = element_text(size = 12, color = "#666666"),
    strip.text.x = element_text(size = 14),
    axis.title.y = element_text(size = 16),
    axis.text.y = element_text(size = 12),
    axis.text.x = element_text(size = 14)
  )
# Final plot
pretty_plot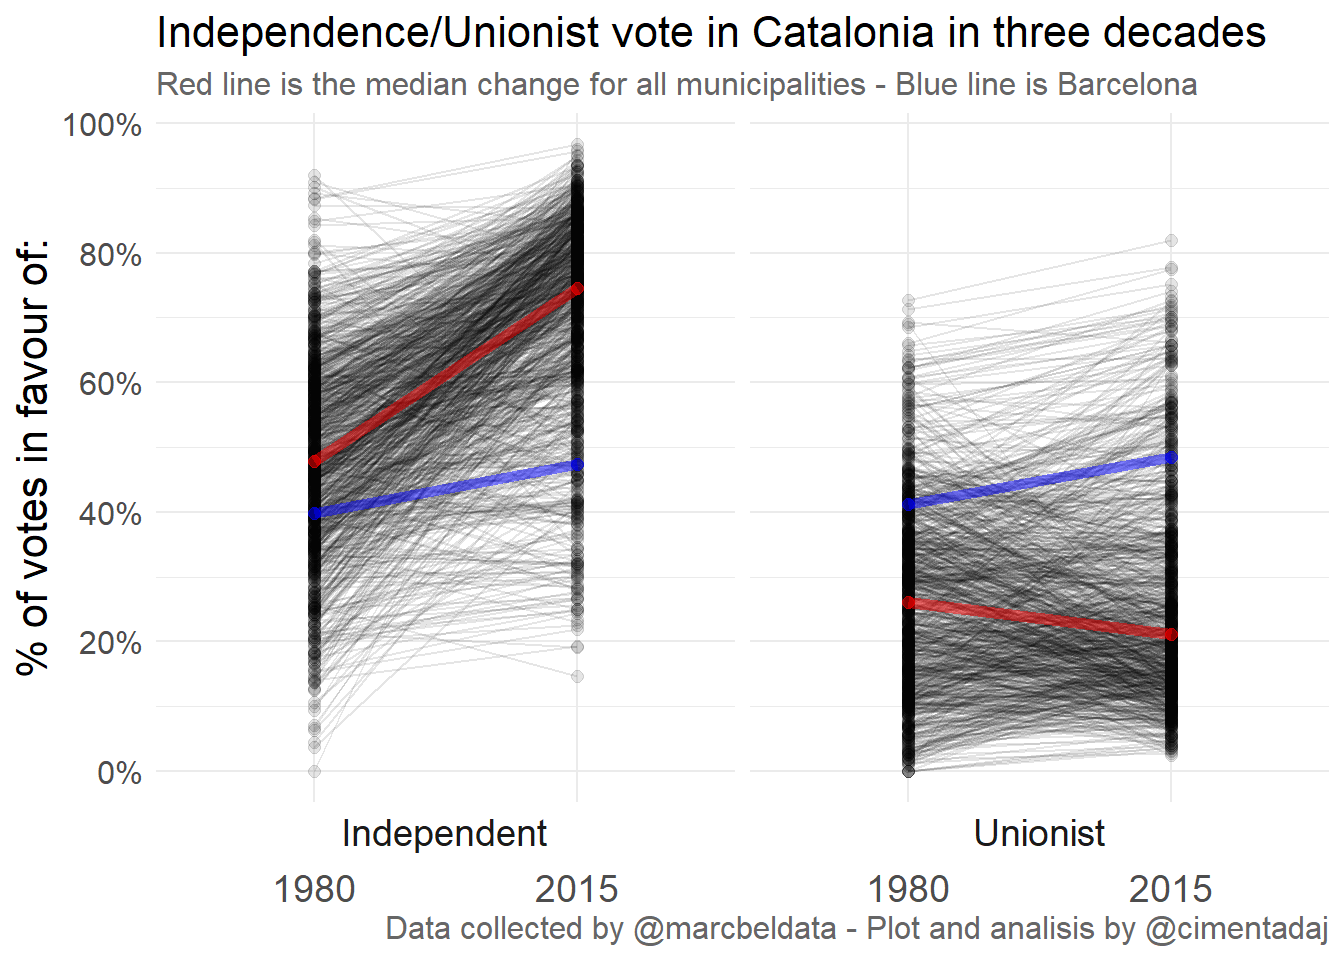
I was very surprised with this plot. On the left panel we can see the increase of independence votes in the last 35 years. The red line is the median change for all municipalities. There is a huge average increase from around 49% to over 70%. In fact, it’s not just an artifact of mean/median with big variance. If we look at the bulk of the distribution on the right line and then the left line, we see an upwards shift in the whole distribution.
On the other hand, the unionist vote seems to have decreased! The left/right distributions seem to be very similar (but it looks like the distribution of the right line has some outliers shifting upwards). But remember something: these are all municipalities. Municipalities might have 1000 citizen or even less! Consider the lonely town in a mountain with 50 people voting for independent parties: that’s also a municipality.
It is for this reason that we need to pay attention to places like Barcelona, which have over 1 million residents and definately weigh in more in proportion. And that’s where the interesting thing about this plot arises: the Barcelona change is practically the same. Not only have the votes increased very very similarly for both sides, but they’re also at the same level of support. Both blue lines look pretty much identical.
Don’t forget: small differences can make a difference, specially in elections. Perhaps they are different but we need to take a closer look.
Let’s plot the independence/unionist evolution only for Barcelona.
# Plot for indy/unionist vote over time only for Barcelona
Catalan_elections %>%
  filter(Municipality == "Barcelona") %>%
  ggplot(aes(Year, Percent, group = Option, colour = Option)) +
  geom_line(alpha = 0.5, size = 2) +
  scale_x_continuous(name = NULL) +
  scale_colour_discrete(name = NULL) +
  scale_y_continuous(name = "% of votes in favour of:",
                     lim = c(0, 100),
                     breaks = seq(0, 100, 20),
                     labels = percent(seq(0, 1, 0.2))) +
  labs(
    title = "Overtime votes for independence/unionist in Barcelona",
    caption = "Data collected by @marcbeldata - Plot and analisis by @cimentadaj"
  ) +
  theme_minimal() +
  theme(
    plot.title = element_text(size = 16, family = "Arial-BoldMT"),
    plot.subtitle = element_text(size = 12, color = "#666666"),
    plot.caption = element_text(size = 12, color = "#666666"),
    legend.position = "top",
    legend.text = element_text(size = 14),
    strip.text.x = element_text(size = 14),
    axis.title.y = element_text(size = 16),
    axis.text.y = element_text(size = 12),
    axis.text.x = element_text(size = 14)
  )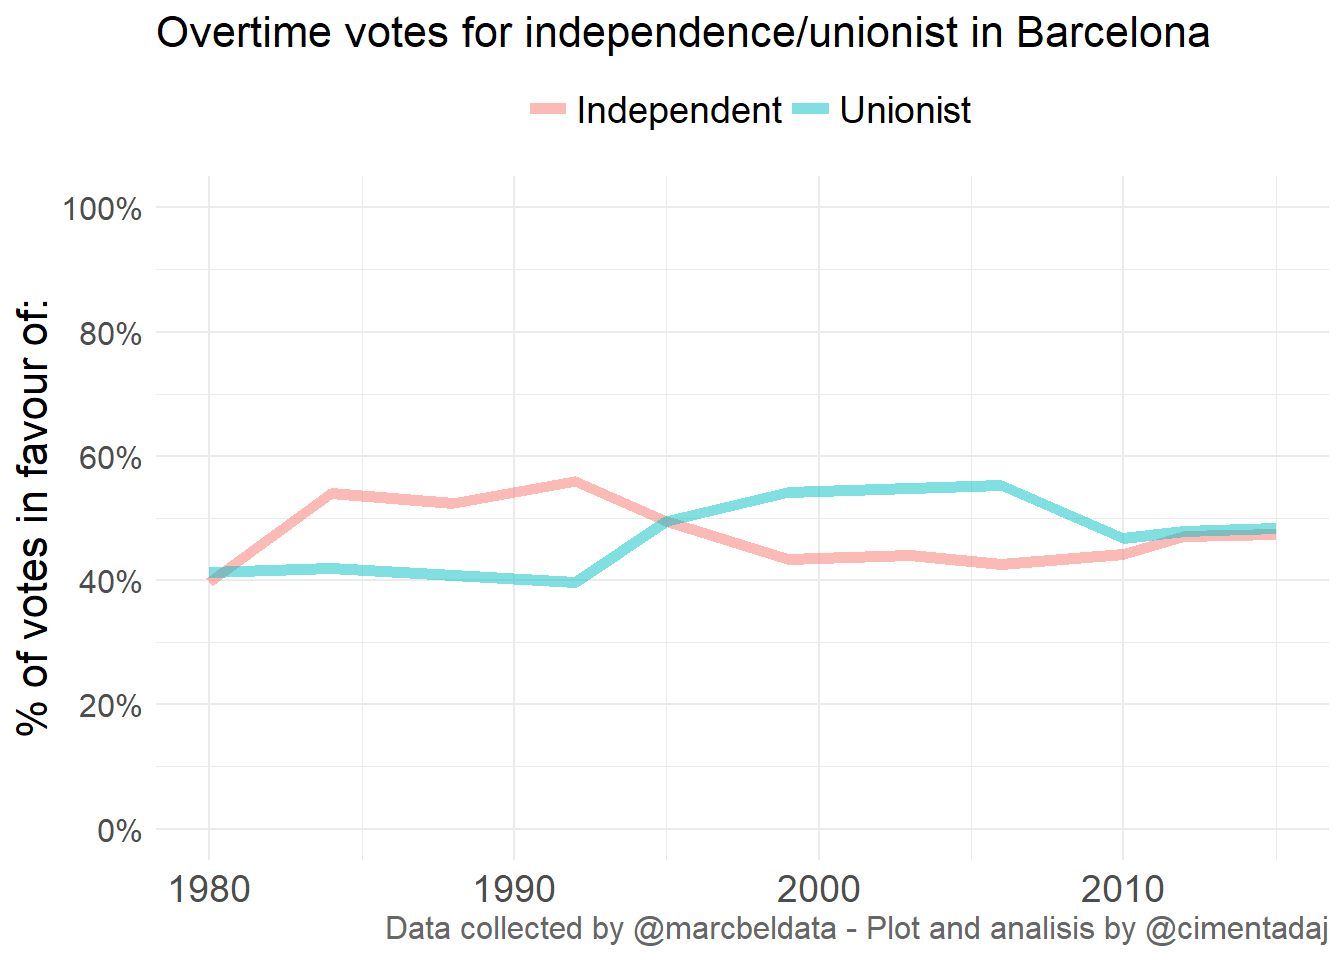
Despite most municipalities are for independence, Barcelona, by only a small margin, has a majority of people voting for unionist parties. Be aware that these votes are not ‘referendums’ carried out every year. These are votes towards independence/unionist parties, which is a different thing. Also note that these are not predictions/forecasts, so they don’t have uncertainty intervals or margins of errors. This is empirical data from voter turnout.
I also tried other big municipalities such as Sabadell and found that unionism trumps over independence much strongly. Yet in others like Lleida, Independence seems to be on top. For a look at specific municipalities, check the post by Marc Belzunces
A note on next week’s elections
This data takes us as far as 2015. Catalonia has suffered dramatic changes since 2015 specially due to the independence movement. These data are most likely not a good representation of what’s gonna happen next week. Big municipalities have usually been majority unionists according to polls, but the differences are tiny and we’ve seen dramatic changes with independence parties proclaiming unilateral independence. There are good attempts at predicting catalan elections (in Spanish) so tune in next week to see what happens.