1..2..3..check!
1..2..3..check! This is my first post using blogdown. I migrated my website from Jekyll to Hugo and although it took me around 2 days to tweak everything to where I wanted it, the process wasn’t so bad after all. As a celebration, I though of doing a quick analysis!
I live in Barcelona, a city known for sunny weather, great football and for wanting to become an independent state. In fact, just recently there was an unsuccessful attempt to break parts with the Spanish nation. Without delving too much into it, I searched for any question related to nationalism into the European Social Survey and downloaded the last available wave using the ess package.
library(essurvey)
library(cimentadaj)
library(tidyverse)

spain_df <- import_country("Spain", 7, "your_email@gmail.com")
spain_df is now a data frame containing the 7th ESS round. Next we have to recode the autonomous communities which are in a ESS format. We’re interested in two variables, region and fclcntr, the second one asking whether the person feels closer to Spain.
Note: did you notice the comunidades tibble there? I pasted that with no effort with datapasta! If you’re using Rstudio, just copy the table from your source and use Shift + CMD + T (on a mac) to paste it as a very nice tibble.
comunidades <- tibble::tribble(
  ~ round,                      ~ country,
  "ES11",                      "Galicia",
  "ES12",      "Asturias",
  "ES13",                   "Cantabria",
  "ES21",                  "País Vasco",
  "ES22",  "Navarra",
  "ES23",                    "La Rioja",
  "ES24",                      "Aragón",
  "ES30",         "Madrid",
  "ES41",             "Castilla y León",
  "ES42",          "Castilla-La Mancha",
  "ES43",                 "Extremadura",
  "ES51",                    "Cataluña",
  "ES52",        "Valenciana",
  "ES53",               "Illes Balears",
  "ES61",                   "Andalucía",
  "ES62",            "Región de Murcia",
  "ES63",    "Ceuta",
  "ES64",  "Melilla",
  "ES70",                    "Canarias"
)

var_recode <- reverse_name(attr(spain_df$fclcntr, "labels"))

ready_df <-
  spain_df %>%
  transmute(com_aut = deframe(comunidades)[region],
         close_cnt = factor(var_recode[fclcntr],
                            levels = var_recode[1:4],
                            ordered = TRUE))
Next up we calculate the percentage of respondents within each category and within each region and visualize it.
perc_table <-
  ready_df %>%
  count(com_aut, close_cnt) %>%
  group_by(com_aut) %>%
  mutate(perc = (n / n())) %>%
  filter(!is.na(com_aut), !is.na(close_cnt))


perc_table %>%
  ggplot(aes(close_cnt, perc)) +
  geom_col() +
  facet_wrap(~ com_aut) +
  labs(
    x = "How close do you feel to Spain?",
    y = "Percentage"
  ) +
  ggtitle(label = "Closeness to Spain by autonomous communities") +
  theme_minimal() +
  theme(
    axis.text.x = element_text(angle = 90),
    plot.title = element_text(size = 16, family = "Arial-BoldMT"),
    plot.subtitle = element_text(size = 14, color = "#666666"),
    plot.caption = element_text(size = 10, color = "#666666")
  ) +
  coord_flip()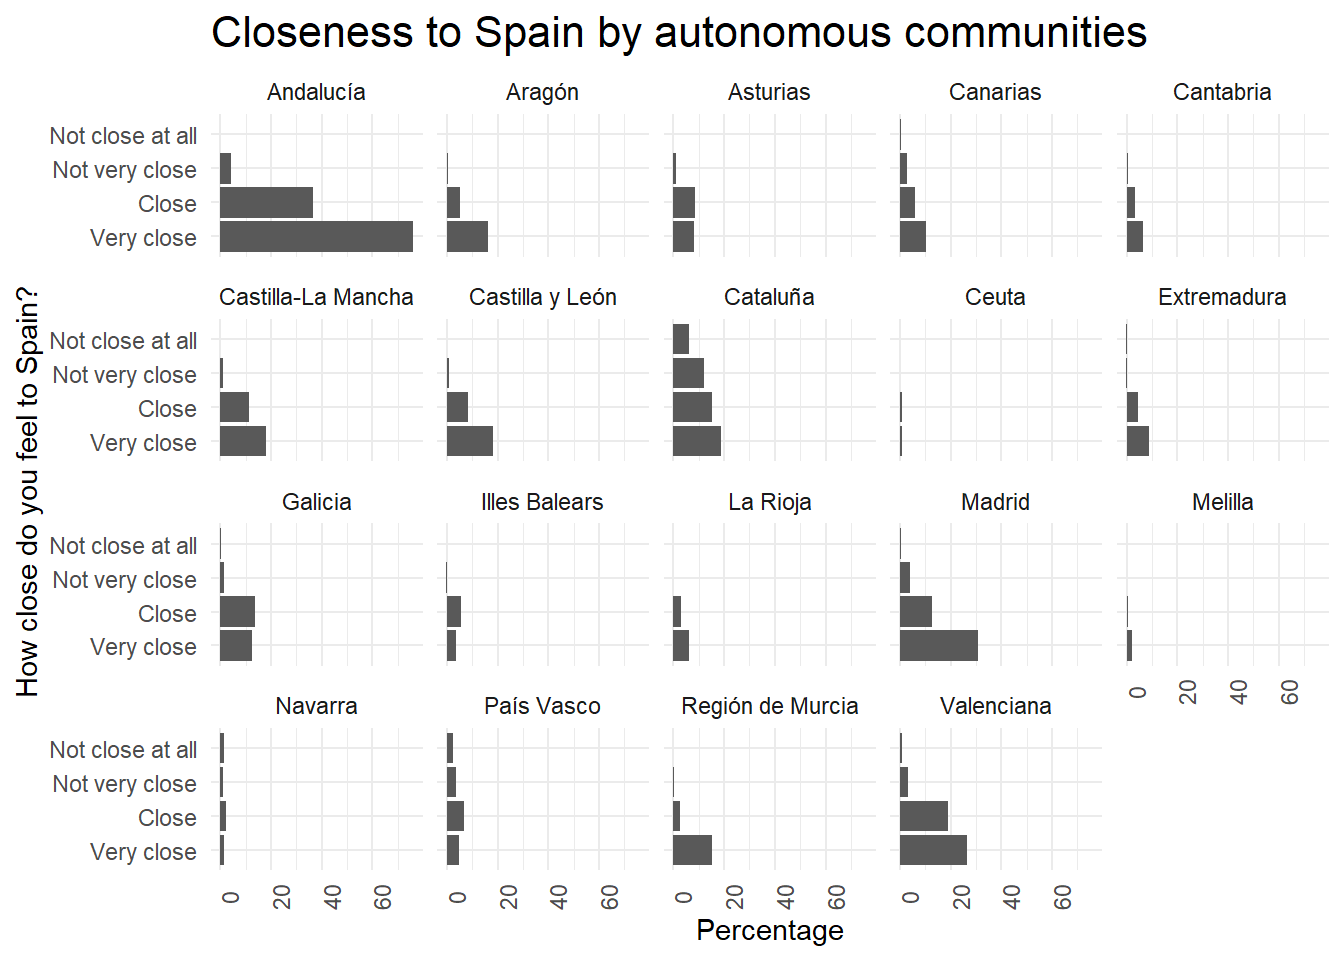
Catalonia does seem to be the region with the highest share of respondents saying that they don’t feel close to Spain, although the vast majority does say they feel very or just close to Spain. On the other hand, Andalucia does comply with stereotypes! They certainly feel very close to the Spanish identity.
My blogdown workflow is very easy:
Create a post with my function
cimentadaj::my_new_postwhich is a wrapper aroundblogdown::new_postRun
blogdown::serve_siteto have a realtime visual of how my blog post is being renderedWrite blogpost
Run
blogdown::build_site. This can take long if you posts that takea long time to compilePush to github (although this is more complicated because I have two branches, one for developing content and the other for pushing to the website. Maybe I’ll write a post about this once)
Bloggin with blogdown was so easy that I think I’m gonna start bloggin more now…